How To Show Values & Percentages in Excel Pivot Tables

Want to Be a Power Analyst?

They have a secret… The power analysts NEVER, repeat NEVER report any raw numbers directly.

They only talk in PERCENTAGES!

  • there were 4.3% new jobs created in the last quarter, 
  • the economy shrank 2.45% year on year…
  • the ROI increased 5.34% in this month compared to the previous month, or
  • the customer service satisfaction index improved by 4.8% this quarter, over the industry average…

This is how analysts speak. So up your game, and speak in Percentages only from now onwards…

But where do you get all these percentages from in Excel?

To create a Percentage Table in Excel, all you need to do is to learn the simple Pivot Table techniques of Excel.

These techniques help you to show both values and percentages at the same time. It’s like having your cake and eating it too!

Pivot Table Showing Values & Percentages

Ever since I published the How to Analyze data with Pivot Tables Video on YouTube, I receive an average of 2-3 new queries every day, asking for more tips on getting more juice out of using Pivot Tables in Microsoft Excel. I have now created the ultimate guide of 10 Methods to Summarize Data in Excel.

This tip about showing Percentages in the Pivot table is pretty simple, yet it could make you into the next Power Analyst you see on CNBC or other TV News channels.

You see, analysts crunch numbers on Business Shows, News Channels all day long. And they make it look so sexy, so cool….

They talk about Year or Year Growth, Quarterly Income Growths, Dividend per share, and most importantly, the presentation has an impact on you… because they talk about percentages.

Simply learn this neat trick to Display Values & Percentages in Excel Pivot Tables.

Yes, a simple “We have 528 widgets” does not make anyone notice the numbers or their impact on the business.

But the same thing converted into “28% of our inventory is stuck in widgets” can make a big difference and make people take notice of what you say.

Want to Improve Your Excel Skills?

Learn the Key Features of Excel Quickly & Easily, by Joining the
Online Training on Basic / Intermediate Excel.

To Get Most out of Excel, Learn the  Pivot Table techniques in our
Pivot Table Masterclass Training
!

How to Convert Numbers Into Percentages?

Well, most of the time, this nifty trick can be done using the basic Pivot Table in Excel. And the version of Excel does not matter. You could use Excel 2010, Excel 2013, Excel 2016, Excel 2019 or even the latest Microsoft  Office Excel 365. Pretty much any version of Excel will do.

Let’s say you are showing Categories, Products and their inventory in a Pivot Table like below.
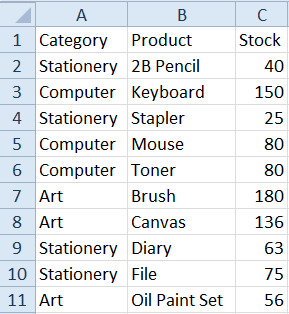
Rawdata before Pivot Creation

It is useful to see the inventory by category, but it does not clarify things. So let’s add some clarity to our Pivot table, by adding a percentage.

Adding a Percentage Column in the Pivot Table
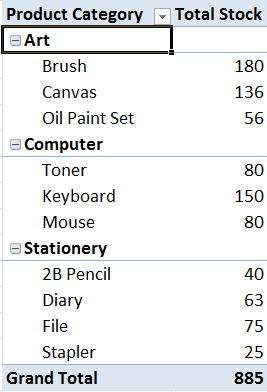
Inventory by Category in Pivot

If you just drag the Stock field to the Values section of the Pivot Table one more time, the output Pivot Table would look like this.
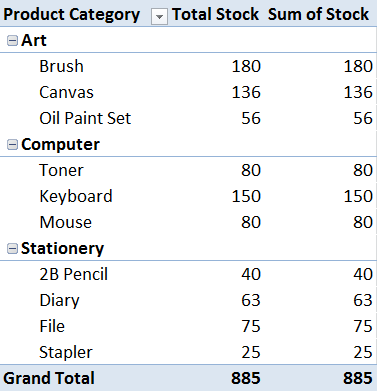
after_adding_second_value_in_pivot
Pivot Table showing 2 identical sets of columns for the values

Now you click the Second Stock Field (Sum of Stock) in the Values section and click on it again. You will see a popup like below.

Show Value As Popup in Microsoft Excel 2010
Show Value as Popup

Choose Show Value As > % of Grand Total. In some versions of Excel, it might show as % of Total. This is fine.

Newer versions of Excel,  like Excel 2016, Excel 2019 or Microsoft 365, show a % of Grand Total when you right-click on any numeric value. This is the key way to create a percentage table in Excel Pivots.

The Pivot view now changes to this:

Pivot with Values & Percentages
Pivot showing Values & Percentages both at the same time

Isn’t it magical! Now you can see that the Art category accounts for 42% Inventory, and Computer Products account for 35%, followed by Stationery, at 23%.

After converting the raw numbers into percentages, it is more insightful than looking at absolute numbers only.

And applying such nifty techniques to create a Percentage Table converts you into a Power Analyst who talks in Percentages, not just numbers.

Use this neat trick to convert numbers into percentages, and especially convert it to a % of Grant Total. It is a really useful technique.

I am sure you will love this simple technique.  Hope it helps! Do share it with others on Facebook or LinkedIn.

And do comment or write to tell me of any issues you are facing in using Excel every day. There may be a simple solution that can save you a lot of time. At ExcelChamp, I solve many small problems each day to make Excel easy for everyone.

Are you facing any problem in using Excel? Any Question?

You have come to the right place. Tell us your needs. We’ll be glad to help you!

Cheers
Vinai Prakash

Need Tips on Pivot Tables, Data Analysis or Creating Better Charts?

Do check out these useful articles & Video Resources

And if you want to learn Advanced Excel fast, then check out our detailed guide.

Want to Improve Your Excel Skills?

Learn the Key Features of Excel Quickly & Easily, by Joining the
Online Training on Basic / Intermediate Excel.

To Get Most out of Excel, Learn the  Pivot Table techniques in our
Pivot Table Masterclass Training
!

Microsoft Excel Shortcuts

Make life simpler with these short cut keys in Microsoft Excel. Save Time & Increase Productivity!

Ever since I wrote about how to view all the formulas in Excel using a single click, I have been requested for more such Excel Shortcuts that save time. So here goes… There are some absolute gems that have been my favorite for years!

Shortcuts that work inside Excel Worksheets

  • Ctrl + F: Display the Find & Replace Dialog box, with Find selected
  • Shift + F4: Repeat Last Find
  • Ctrl + Z: Undo last action. Works for multiple levels
  • Ctrl + Y: Redo last action.
  •  F11: Create and Insert a Chart based on the selected data. Chart is added in a separate sheet.
  • Alt + F1: Creates a inserts a chart based on the currently selected data as an embedded chart object.
  • Ctrl + K: Insert a Hyperlink in a cell

Format Cells

  • Ctrl + 1: Format Cells Dialog box
  • Ctrl + 2: Apply or remove Bold formatting. Also works as Ctrl + B
  • Ctrl + 3: Apply Italic formatting to selected text
  • Ctrl + 4: Underline or remove the underline from the selected data. Also works as Ctrl + U

Apply Number Formatting

  • Ctrl + Shift + $: Apply Currency format with 2 decimal points
  • Ctrl + Shift + ~: Apply the General number format
  • Ctrl + Shift + %: Apply the Percentage format with no decimal places at all.
  • Ctrl + Shift + #: Apply the date format with full day, month and year showing.
  • Ctrl + Shift + @: Apply the time format with hours, minutes, AM or PM showing.
  • Ctrl + Shift + !: Apply the number format with two decimal places, a comma separator for the thousands place, and a minus sign for negative numbers.
  •  

    Want to Improve Your Excel Skills?

    Learn the Key Features of Excel Quickly & Easily, by Joining the
    Online Training on Basic / Intermediate Excel.

    To Get Most out of Excel, Learn the  Pivot Table techniques in our
    Pivot Table Masterclass Training
    !

 Shortcuts for Formulas

  • Alt + =: Auto sum formula is inserted
  • Shift + F3: Insert Function dialog box is opened
  • F4: Cycle through the four states of Relative referencing (A1) to Absolute referencing ($A$1)
  • Ctrl + Shift + Enter: Enter an Array Formula
  • F9: Calculates all the worksheets in all open workbooks
  • Ctrl + `: Shows all formulas. Toggle switch that shows and hides the formulas. If you can’t find the key, you can locate it just above the left Tab key. My favorite shortcut.
  • F2: Edit the formula or selection in any cell
  • F3: Paste a defined name into a formula. Using Range Names.
  • Ctrl + F3: Define a range name for a single cell or a range of cells.

Managing Workbooks

  • Ctrl + F4: Close the currently selected workbook window.
  • Ctrl + N: Open a New and blank workbook in Excel
  • Ctrl + Tab: Move to the Next Worksheet within the workbook.
  • Ctrl + Shift + Tab: Move to the Previous worksheet within the same workbook
  • Ctrl + F9: Minimize the current workbook
  • Ctrl + F10: Restore the selected workbook into a full window
  • F12: Save As diaglog box to save the workbook
  • F7: Do a Spell check in Excel
  • F1: Ask for Help ( internal Excel in built help pops up)
  • Shift + F7: Display the Thesaurus
  • Alt + F8: Displays the macro dialog box
  • Alt + F11: Pops up the Visual Basic Editor for editing the macros.

Hopefully these macros will help you save time and improve your productivity.

If you have any other shortcut which you find useful, do send me a note. I would love to hear from you. You can send it to vinai@excelchamp.net.

Cheers,
Vinai Prakash

Are you facing any problem in using Excel? Any Question?

You have come to the right place. Tell us your needs. We’ll be glad to help you!


I teaches Excel, Advanced Excel techniques, and Dashboarding techniques in various countries. If you have a group of 10 or more participants,  I can come down to do a workshop for your group in your country – Vinai

Do You Use These Features of Microsoft Excel?

Most people hardly use the most useful features available in Microsoft Excel. Many are just using Excel as a calculator to do basic calculations like adding or subtracting numbers. This is a gross under use of Excel’s vast potential and feature rich functionality.

Do a quick check, and see if you use these advanced features of Microsoft Excel in your day to day work to improve your productivity and efficiency.

  1. Finding the Top 10 Customers or Finding the Bottom 5 Performers in the organization
  2. Give Names to Range of Cells, and then use them in formulas for easy referencing and decoding – like =Salary – CPF + Allowance
  3. Exploit Pivot Tables to Summarize the data and slice & dice it in any way – like finding sales by product groups, or calculating productivity by department, or calculating sales by department by product by area.
  4. Write Macros to automate routine things that save you a huge amount of time – example creating different pivots, charts, tables, and doing complex calculations, or compiling the cost benefit ration, cash flow statement automatically.
  5. Highlight values that are above or below a certain threshold – like all sales above $25,000 to be highlighted, or all products with a net profit margin of less than 5% be highlighted.
  6. Sort the values in Ascending, Descending or any Customized sorting order – like sorting in order of Manufacturing, Accounts, Sales departments.
  7. Use advanced filtering conditions, and be able to filter data using multiple different criteria – like salary > 50,000 and sales <100,000 or Zone in East, West.
  8. Create fantastic charts that portray the given business situation perfectly. There are over 50 different types of charts to choose from, and each has its edge, advantages and a reason. Do you know when to use which type of chart – like two axis charts, stacked column and line charts, bubble charts, pie, slice of a pie etc.
  9. Create management dashboard that are dynamic, and provide a complete snapshot of the key business KPIs in the company – change the chart values at the click of a checkbox or change in a dropdown value
  10. Use Excel’s advanced What-If analysis to do projections for future, forecasting, trend analysis etc. with ease
  11. Use Lookup tables to find any value or corresponding value from a table using advanced functions and formulas – find values that in the left of the looked up value
  12. Protect certain cells from data entry, and hide the formulas from other cells. Ensure that only certain values are keyed in the cells to avoid data discrepancies.

Want to Improve Your Excel Skills?

Learn the Key Features of Excel Quickly & Easily, by Joining the
Online Training on Basic / Intermediate Excel.

To Get Most out of Excel, Learn the  Pivot Table techniques in our
Pivot Table Masterclass Training
!


This is just the tip of the iceberg… These are common things that can be done easily with Excel’s in-built features.

So how many of these did you know? And how many would you like to learn more about? Even if you learn one new trick in Excel, it will save you immense time and improve your productivity. Investing in Microsoft Excel Training bears fruit in no time, and is a no brainer.

Microsoft Excel is really extremely powerful. Each version of Microsoft Excel – be it Excel 2007, or Excel 2010 or Excel 2013, Excel 2016 or Office 365 adds more and more features to the already powerful dynamite of a package.

At ExcelChamp, we teach people how to leverage the maximum power out of Microsoft Excel in short training courses.

So what are you waiting for? If you would like to learn any one or more of such useful features of Microsoft Excel, just let us know. We provide online training through videos, which will show you each click, step by step, so you can master the new techniques easily, with exercises, and practical examples.

Go ahead, equip your team with the right skills. Get everyone on board to learn the basic and advanced features of Microsoft Excel, and Be Awesome in Excel!

Email to us to know more about Online Excel Training at ExcelChamp.Net.

Cheers,
VInai Prakash, PMP, ITIL, GAP, Six Sigma, Excel Guru

Are you facing any problem in using Excel? Any Question?

You have come to the right place. Tell us your needs. We’ll be glad to help you!