This is a common problem. You import some text file, and half of it seems blank. The problem is that if it is showing blanks, you can’t sum the values.
To replace each blank with a zero is time consuming, boring and stupid. We want a fast method that works in just a few clicks, and saves us loads of time for our families 🙂
There are many ways to achieve this task of replacing Blank with Zeroes, or Replacing Blanks with Any Other Values in Excel.
Method 1: Use the GoTo Method to Find & Replace
Click on Home > Find & Select > GoTo Special. This will open up a new popup window.

Choose Blanks Radio Button, and Click OK.
All the Blank Cells will get highlighted. Do not worry. Simply type a Zero or any other value that you want to put in the blank cells.
Do this in the currently active cell. Press
together.
Voila! The keyed in Values is showing in all the Blank Cells now.
Method 2: Use an IF condition
For example, if you want to selectively key in 0 for blanks, key in this formula below.=IF(A2=””,0,A2)
This formula checks if the cell A2 is blank or not. IF it is blank, it will replace it with a 0, or else it will not change it.
Once done, you can drag the formula to the selected cells. Works beautifully!
Method 3: Variation of the IF Method, using the ISBLANK function
Now we have an in-built function that can check if the cell ISBLANK or not.
=IF(ISBLANK(A2),0,A2)
Same Magic!
If you have any other favorite method, do share it with us below in the comments!
If you’d like to learn more Excel Shortcuts, Tips & Tricks, here are some additional articles:
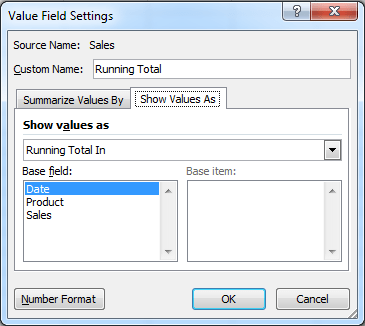
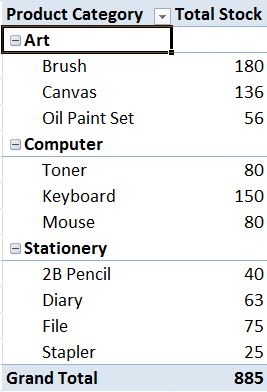
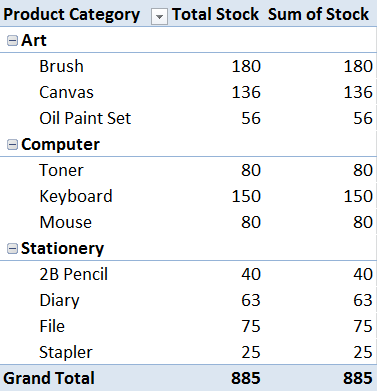
- Display Values and Percentages in Pivot tables
- Analyze Data Using Pivot Tables – How To Tutorial (Video)
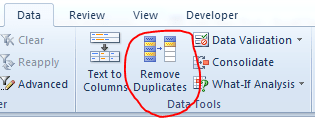
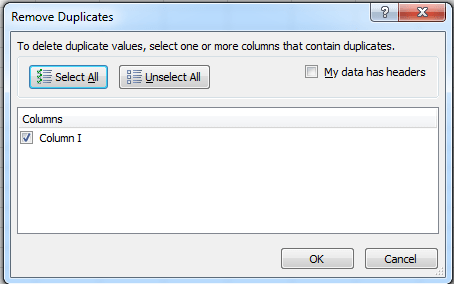
- How to Find & Remove Duplicates Quickly in Excel
- How to Count Cells With a Certain Value in Excel
Questions About Any Feature in Excel?
If you have any questions regarding any feature in Excel, simply post a comment below and I’ll help you with it. All the best!
And Subscribe to our Weekly Excel Tips Newsletter, so we can send you more Short cuts & some Pivot Table Techniques by email. Only useful stuff, without the hype. And we won’t spam you. So don’t worry. Just subscribe!
Cheers,
Vinai Prakash, PMP, ITIL, GAP, Six Sigma
Founder of ExcelChamp.Net
Vinai conducts 1-2 day seminars and Training Sessions on Microsoft Excel all over the world, helping companies maximize their productivity in using Microsoft Excel. If you would like to find out more, simply contact us.